
In brief
For each observation point, the report shows on how many days, for how long and how brightly reflections occur, with tables, charts and maps. Filters determine which reflections count as glare, for example only those within the field of view or above a brightness threshold; they can be changed without simulating again. The PDF is created from the report.
14.1 How to
- After the simulation, choose "Go to results"; later, the report icon at the version under "Versions & Results" opens the report.
- Set the filters for each group of observation points: "Edit filters", choose filters, "Apply filters" (section 14.3).
- Read the results per group and per point (section 14.2).
- Fill in the cover page: title, date, author, optionally client and own logo.
- "Create PDF" and then "Download PDF".
All adjustments are saved automatically with the simulation. The report on screen matches the PDF page by page. It can only be used on a computer.
Structure: cover page, table of contents, project overview, PV areas, obstacles (if entered), observation points, results per group (filters, overview, individual results per point) and appendix with geodata, module types, elevation data sources, simulation parameters, assumptions and glossary; depending on the project also tracker curves, far-field shading, differentiated cross tilt, obstacles, terrain occlusion and excluded areas.
Version and calculation state. The cover page states the version of PV-GlareCheck and the calculation state of the simulation, for example "Calculation state 2026.10.11-5_1a2b3c4d": the engine version and an identifier of the calculation switches used. Under this identifier, quality assurance shows the test results of exactly this state (Ch. D). Simulations before 11 October 2026 carry "Calculation state not recorded"; a worst-case combination of simulations with different states lists it per source (Ch. 13).
14.2 Reading the results
14.2.1 Key figures
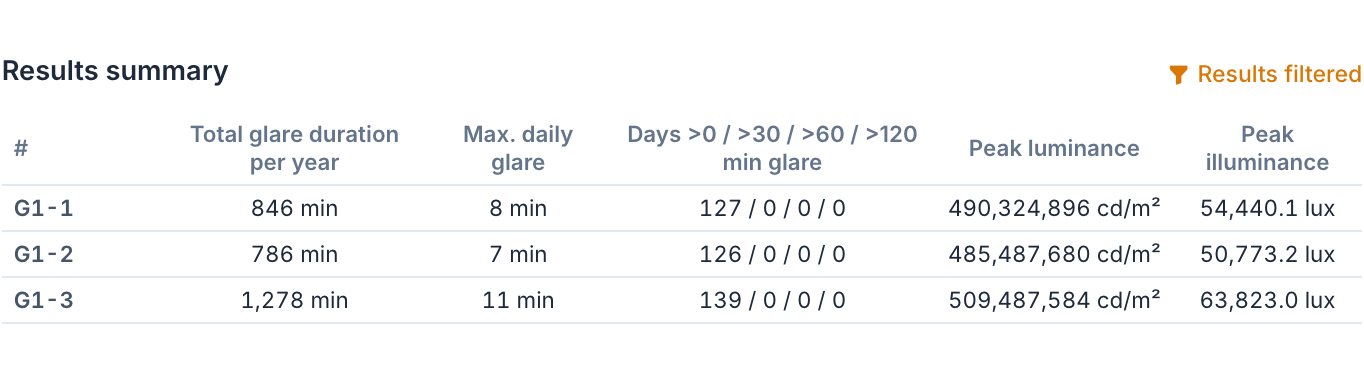
| Key figure | Meaning |
|---|---|
| "Total glare duration per year" | sum of all minutes of the year counted as glare |
| "Max. daily glare" | longest glare duration on one day |
| "Days >0 / >30 / >60 / >120 min glare" | number of days above the respective duration; exactly 30 min does not count towards ">30" |
| "Peak luminance" | highest luminance of a visible reflection in cd/m² |
| "Peak illuminance" | highest illuminance at the eye in lx, all areas of a time combined |
| "Min. gaze axis distance" | smallest angle between viewing direction and glare source; only with a field of view |
| Symbol | Meaning |
|---|---|
| "—" | no reflection occurred |
| 0 | reflections occurred but were removed by the filters |
| "/" | all reflections filtered out, no angle to the gaze axis can be calculated |
| "…" | still being calculated |
A minute counts once, even if several PV areas cause glare at the same time. All times are the project's standard time without daylight saving time. The values apply to a clear sky on every day and are therefore maximum values (Ch. VII).
14.2.2 Figures
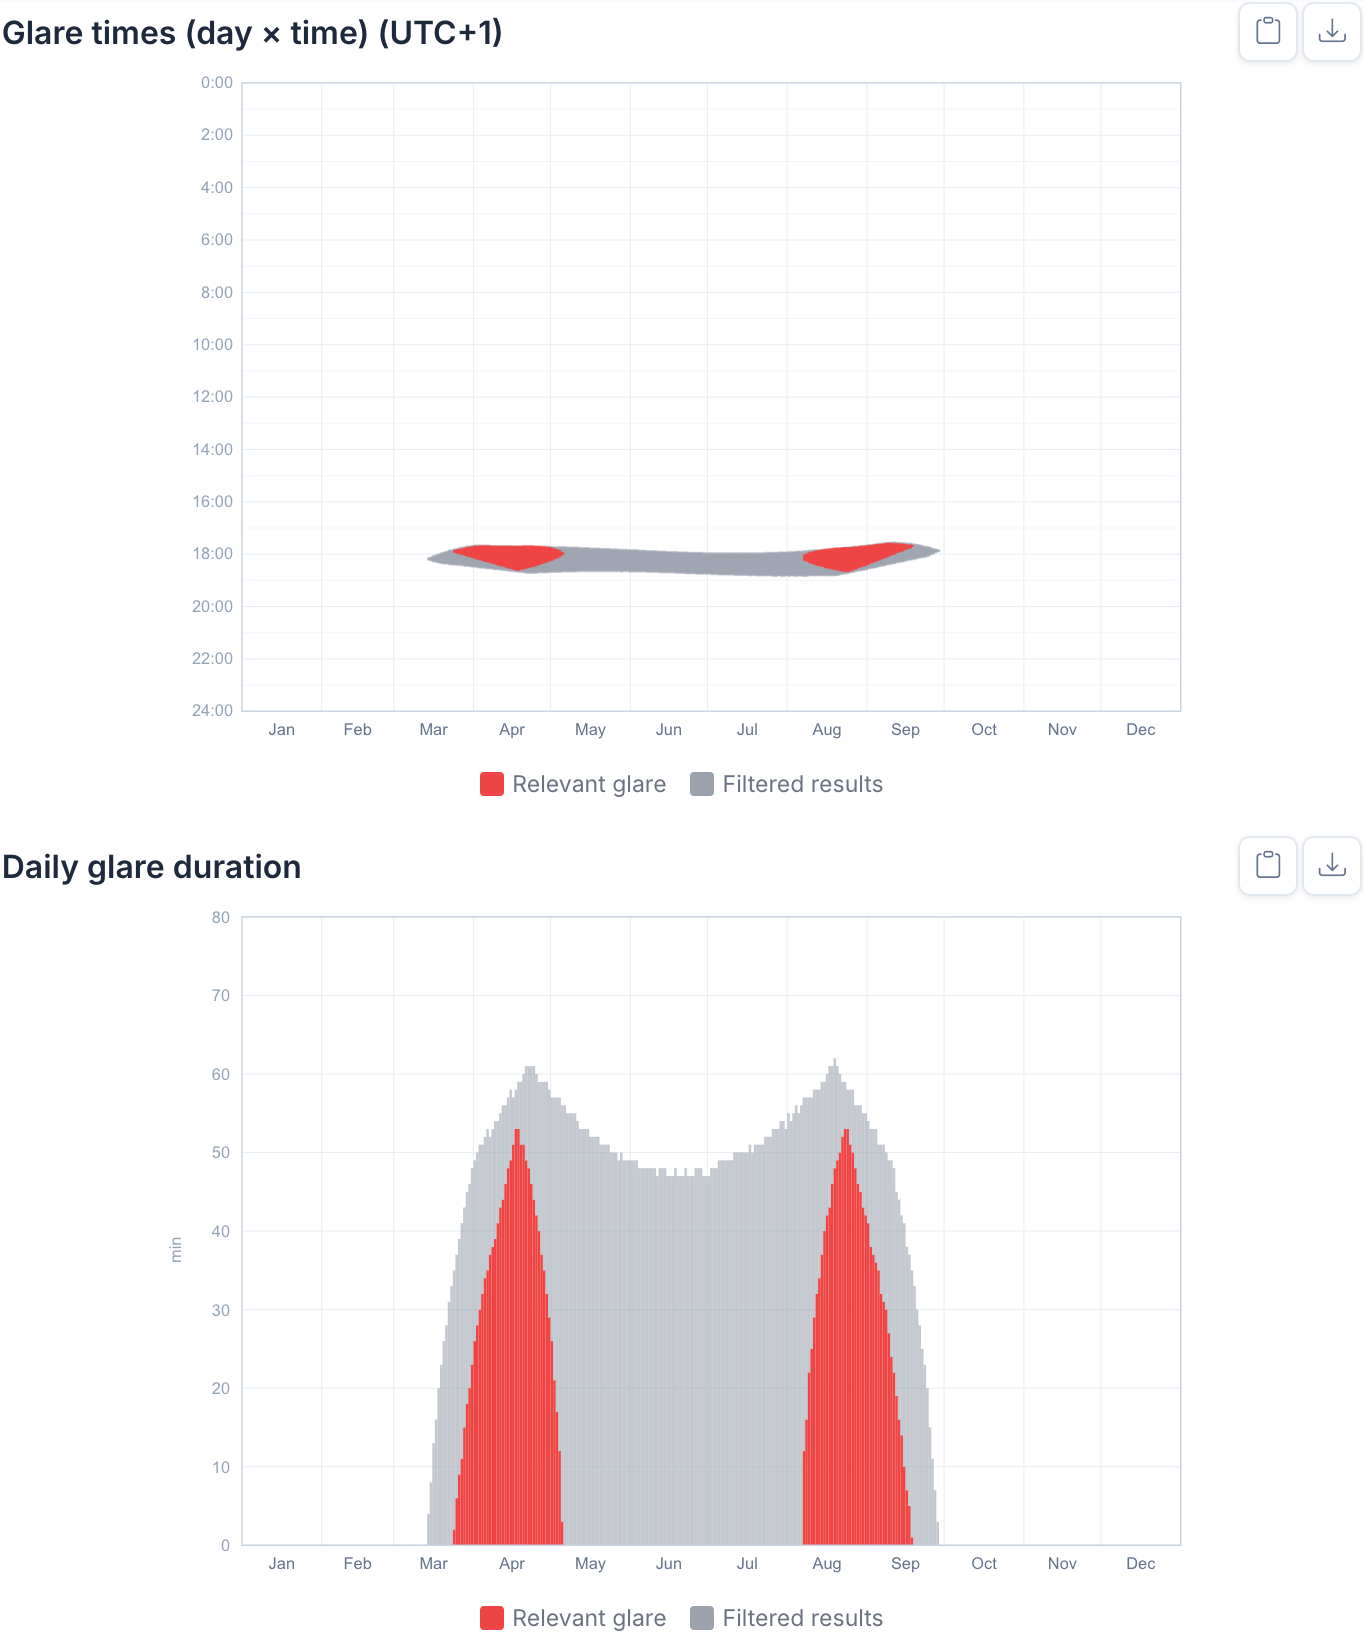
| Figure | shows |
|---|---|
| "Glare times (day × time)" | when in the year and at what time of day glare occurs; days horizontally, time of day vertically |
| "Daily glare duration" | minutes per day; the highest bar is the maximum daily glare |
| "Intensity-coded glare times" | when the brightest reflections occur, colored by luminance or illuminance |
| Results map | location of the point and its field of view relative to the installation |
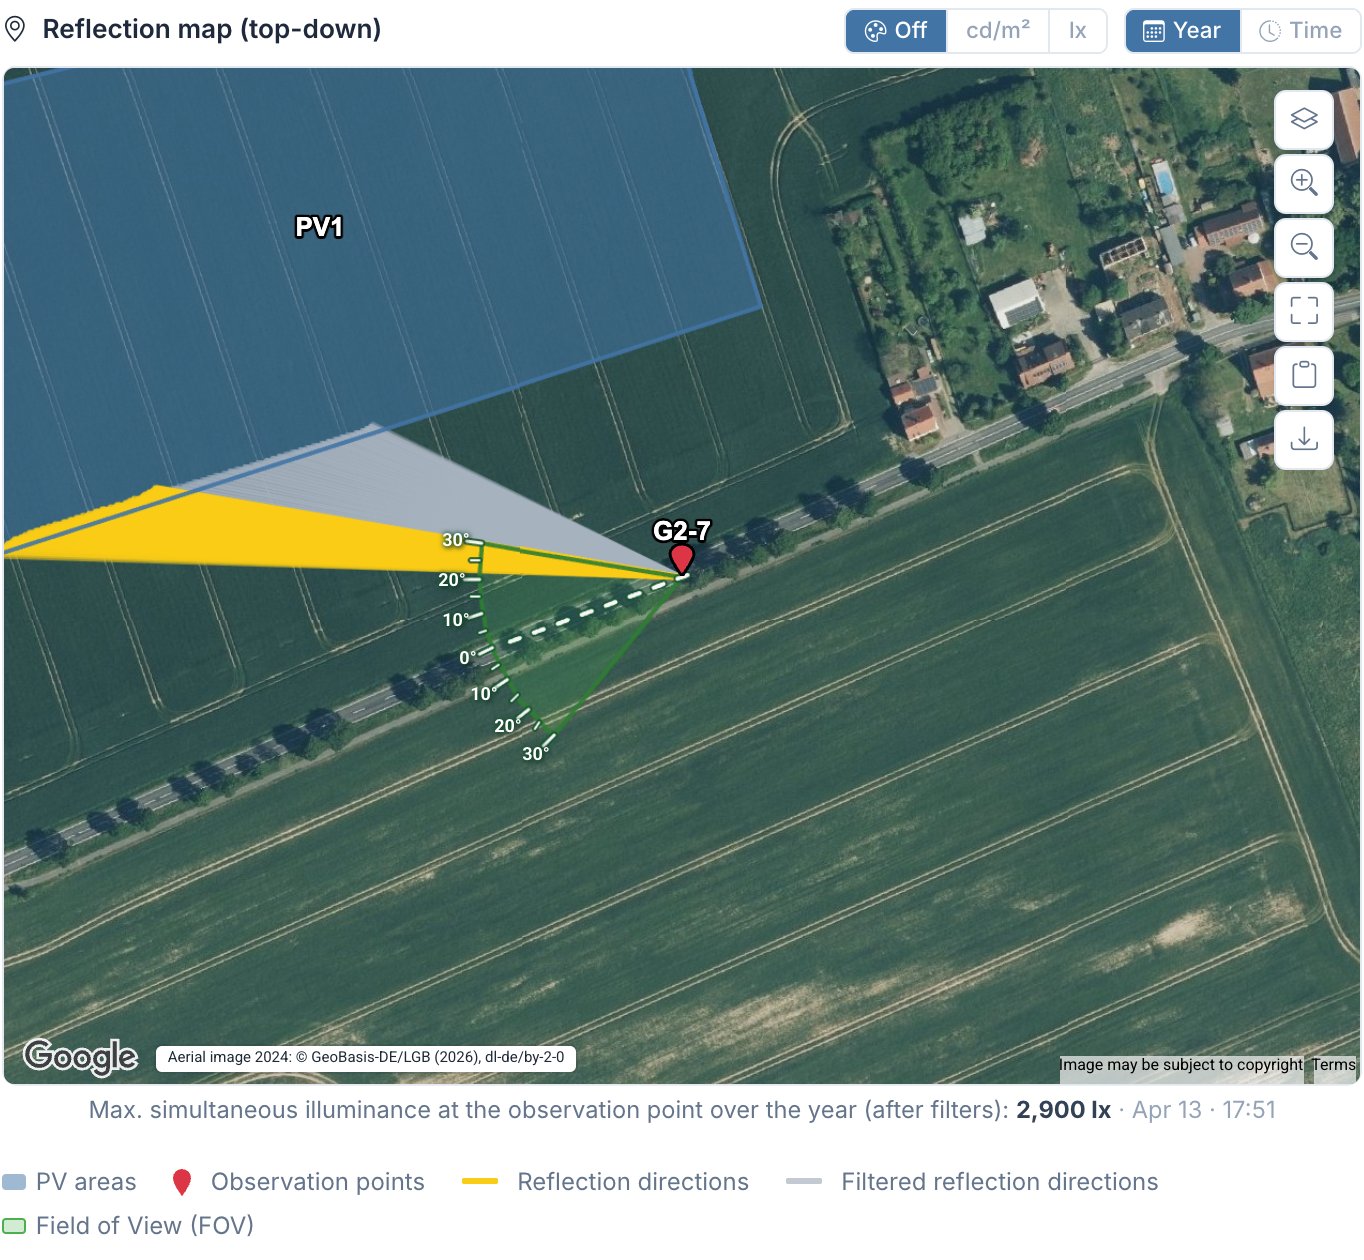
| "Reflection map (top-down)" (optional) | from which directions reflections arrive; the lines show directions, not exact glare locations |
| "3D perspective" (optional) | the installation as seen from the point: where in the field of view the glare source lies, how large it appears and how close to the sun |
Counted glare is shown in color, what the filters removed in gray. On hover, the tooltip names the responsible filter. Reflection map and 3D perspective show either the whole year or a single time; the two optional pages are added to the PDF with "Include in report".
14.3 Filters
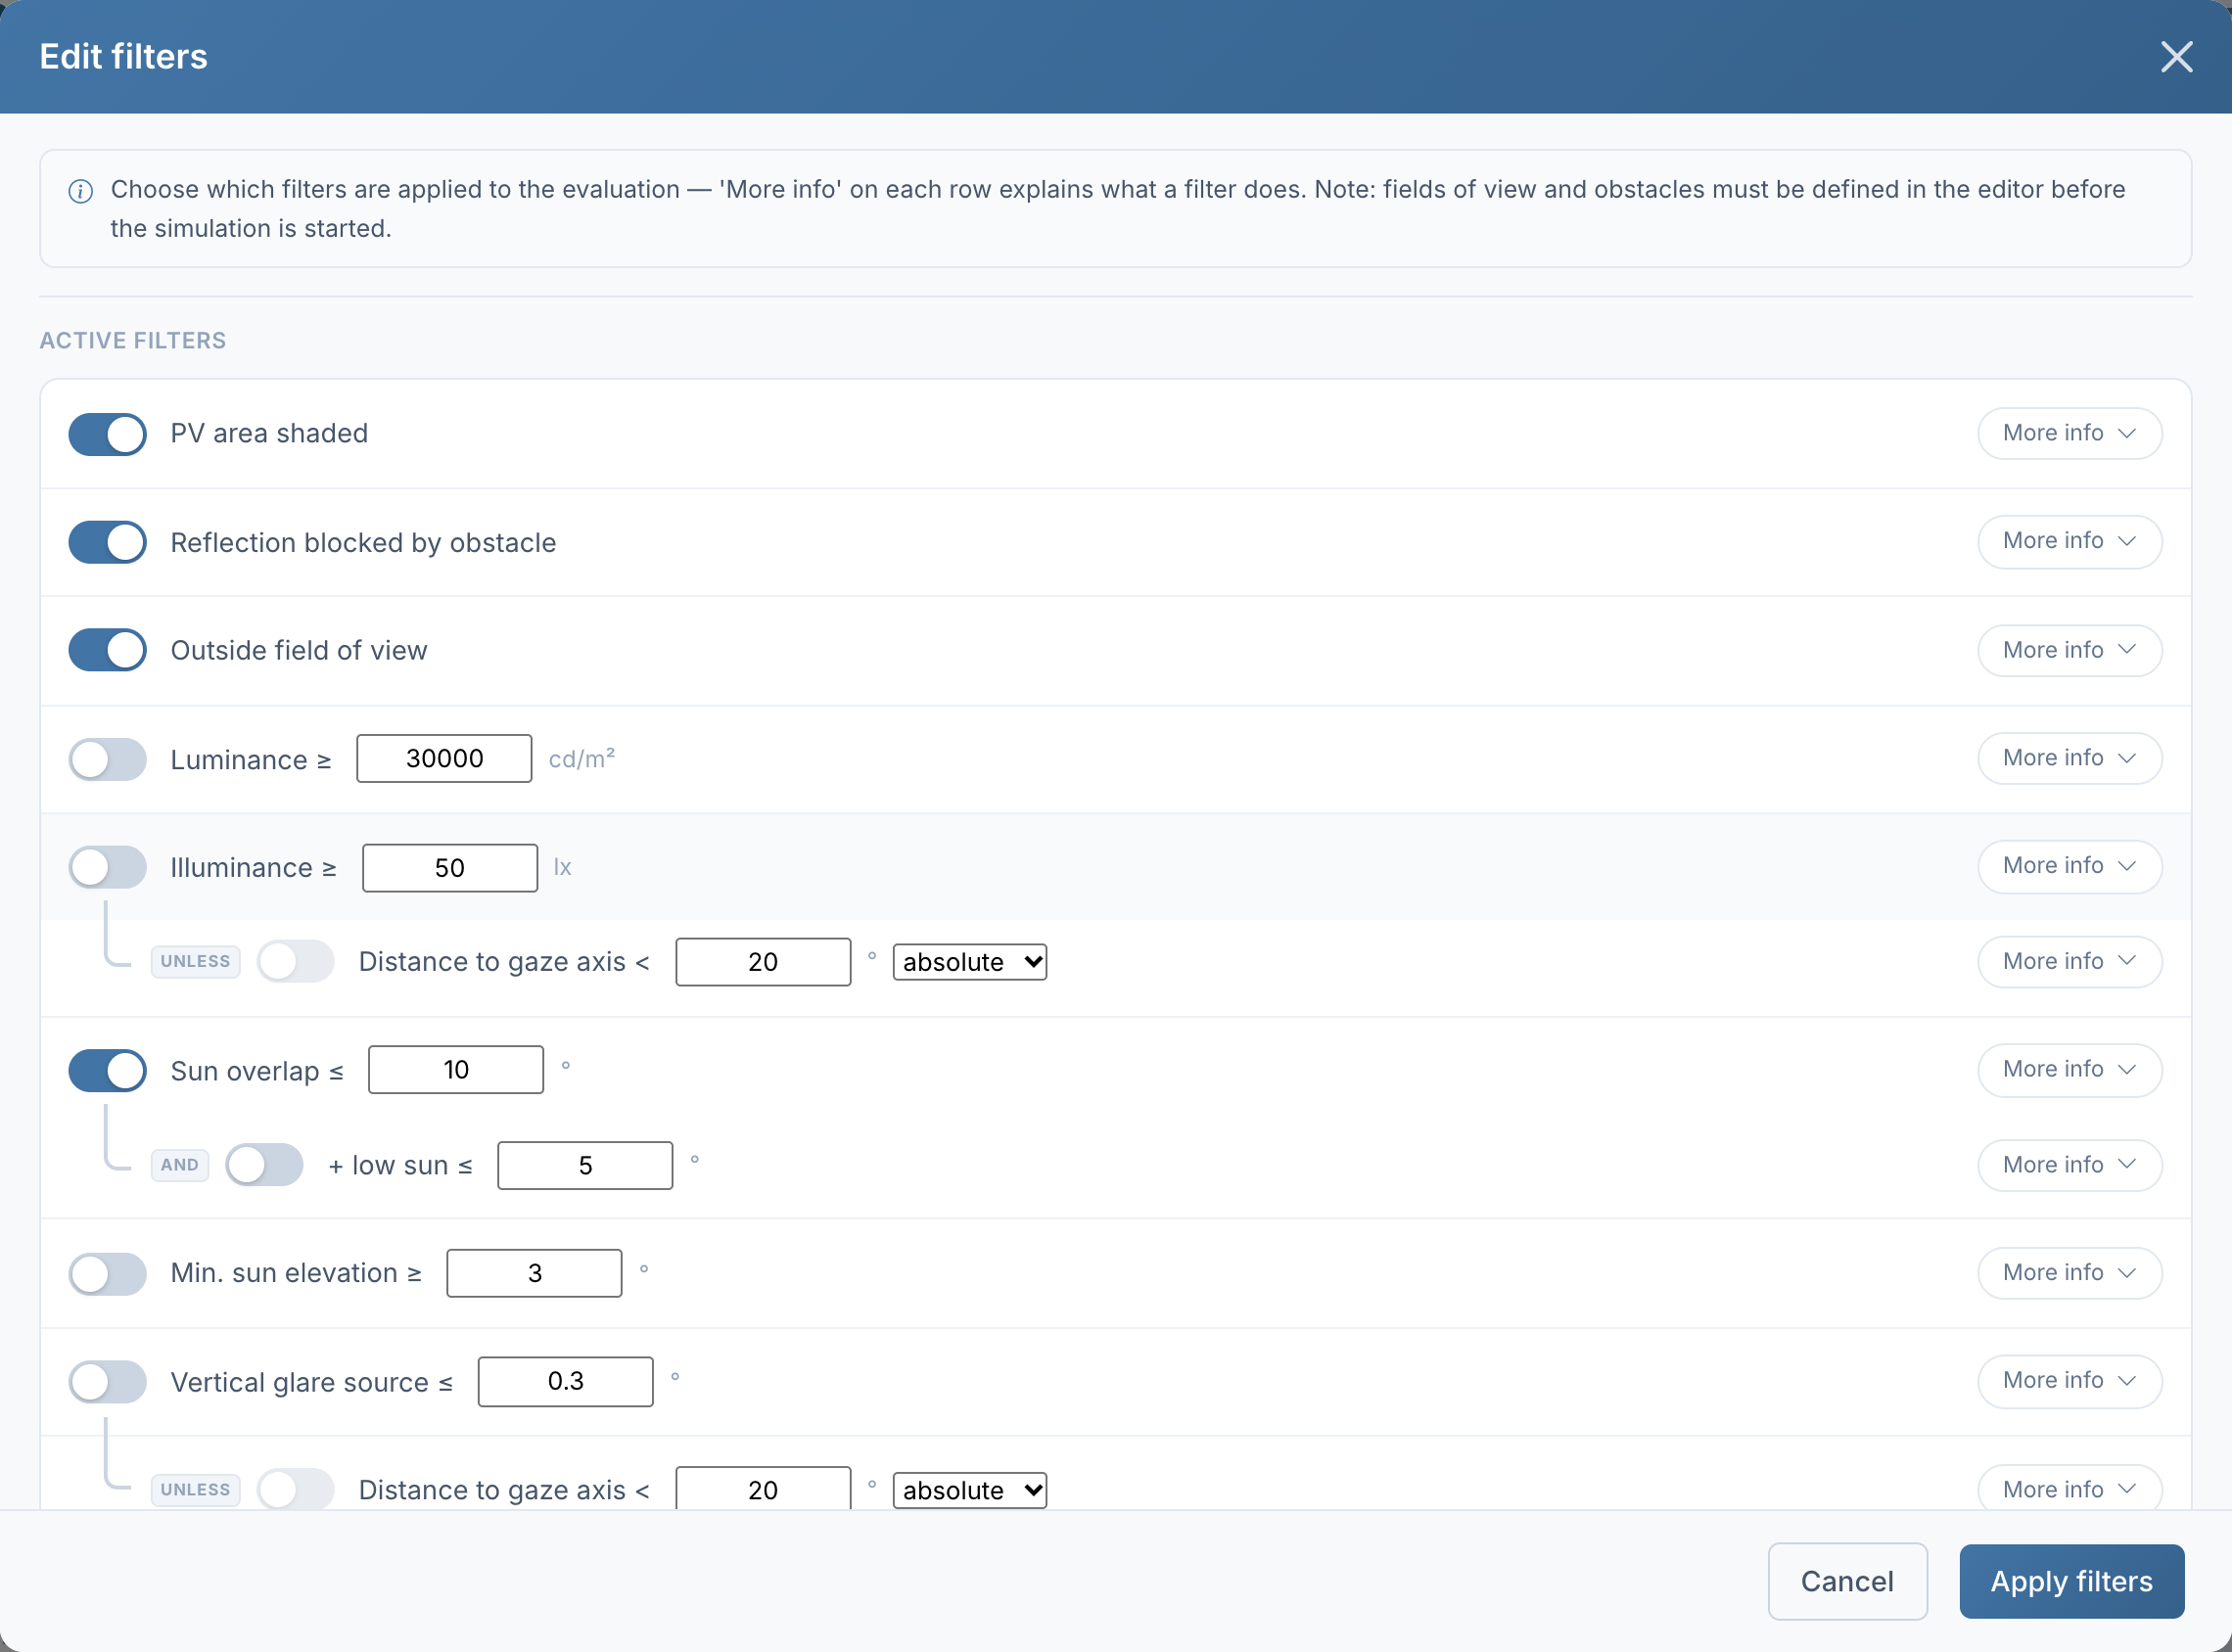
The simulation stores all geometrically possible reflections. The filters determine which of them count as glare, separately for each group. A change only recalculates the report, not the simulation. The filter card at the start of each group documents the setting in the PDF.
| Filter | a minute does not count if … | Default |
|---|---|---|
| "PV area shaded" | the sun does not reach the area (obstacle, horizon) | on |
| "Reflection blocked by obstacle" | an obstacle or the terrain blocks the view | on |
| "Outside field of view" | the reflection lies outside the field of view | on |
| "Luminance ≥" | the luminance is below the value | on, 30,000 cd/m² |
| "Illuminance ≥" | the illuminance at the eye is below the value | off, 50 lx |
| "Sun overlap ≤" | reflection and sun are at most this angle apart | off, 10° |
| "Min. sun elevation ≥" | the sun is lower | off, 3° |
| "Vertical glare source ≤" | the glare source appears at most this high | off, 0.3° |
| "PV areas" | the reflection comes from a deselected area | all included |
Additional conditions refine individual filters: "+ low sun ≤" limits sun overlap to low sun positions, "UNLESS distance to gaze axis <" keeps reflections close to the viewing direction despite the illuminance or size filter.
Which setting corresponds to a guideline is described in Part VI for each protected subject (Ch. VI.1 to Ch. VI.4); how each filter calculates, in Ch. V.8. "Save as Preset" keeps a setting for all of your own reports, "Also apply to:" transfers it to further groups.
14.4 PDF, Excel, figures
- PDF: "Create PDF" produces the PDF from exactly this report. For large projects this takes a few minutes; progress is shown. If something is not completely loaded, such as a map or a key figure, no PDF is created and the message states the reason; the PDF can then be created again.
- Excel (Pro): key figures per point unfiltered and filtered, per PV area, and as detailed data with one row per minute with reflection, point and area; filtered-out reflections remain included and are marked in filter columns. With more than 50 points, the export is split into several files in one ZIP (plan, Ch. 3).
- Figures: every figure can be copied or downloaded as PNG via its toolbar, with legend and source line.
- Demo projects carry the watermark "DEMO" on every page; the Excel export states it on the "Explanation" sheet. That sheet also lists the product version and calculation state.
14.5 Points to note
- A new report is already filtered, among others with "Luminance ≥ 30,000 cd/m²". For an evaluation according to LAI or OVE, this filter is switched off (Ch. VI.1).
- "0" and "—" are different: "0" means reflections were filtered out; "—" means there were none.
- Fields of view, obstacles and module types only take effect in a new simulation; filters take effect immediately.
- Maps: the base map is the official aerial image where available; every map carries its source note. If the official service fails, the map temporarily shows Google Satellite and reports this.
Details: options, pages, limits of PDF creation
Report options. "Options" sets the base map and the map overlays (with opacity) for all maps and determines whether downloaded figures carry their heading. For each map, base map, extent and, where available, dimensioning can be chosen individually; this is saved.
Pages. Each chapter, PV area, group and observation point starts on a new page; the layout is automatic. The table of contents is clickable but has no page numbers. With at most 50 observation points, the reflection map is included by default, the 3D perspective never.
PDF creation. Aborted after 180 s without progress or 15 min in total; at most 20 PDF requests per hour. If a PDF already exists for the same state, it is available immediately. Short server interruptions during loading are retried automatically; if a request keeps failing, the report shows a banner and blocks the PDF.
Large simulations. For the view of a single time, the day is recalculated when needed; after a change of the calculation state (engine version or calculation switches), the report points this out (Ch. V.7).