
In brief
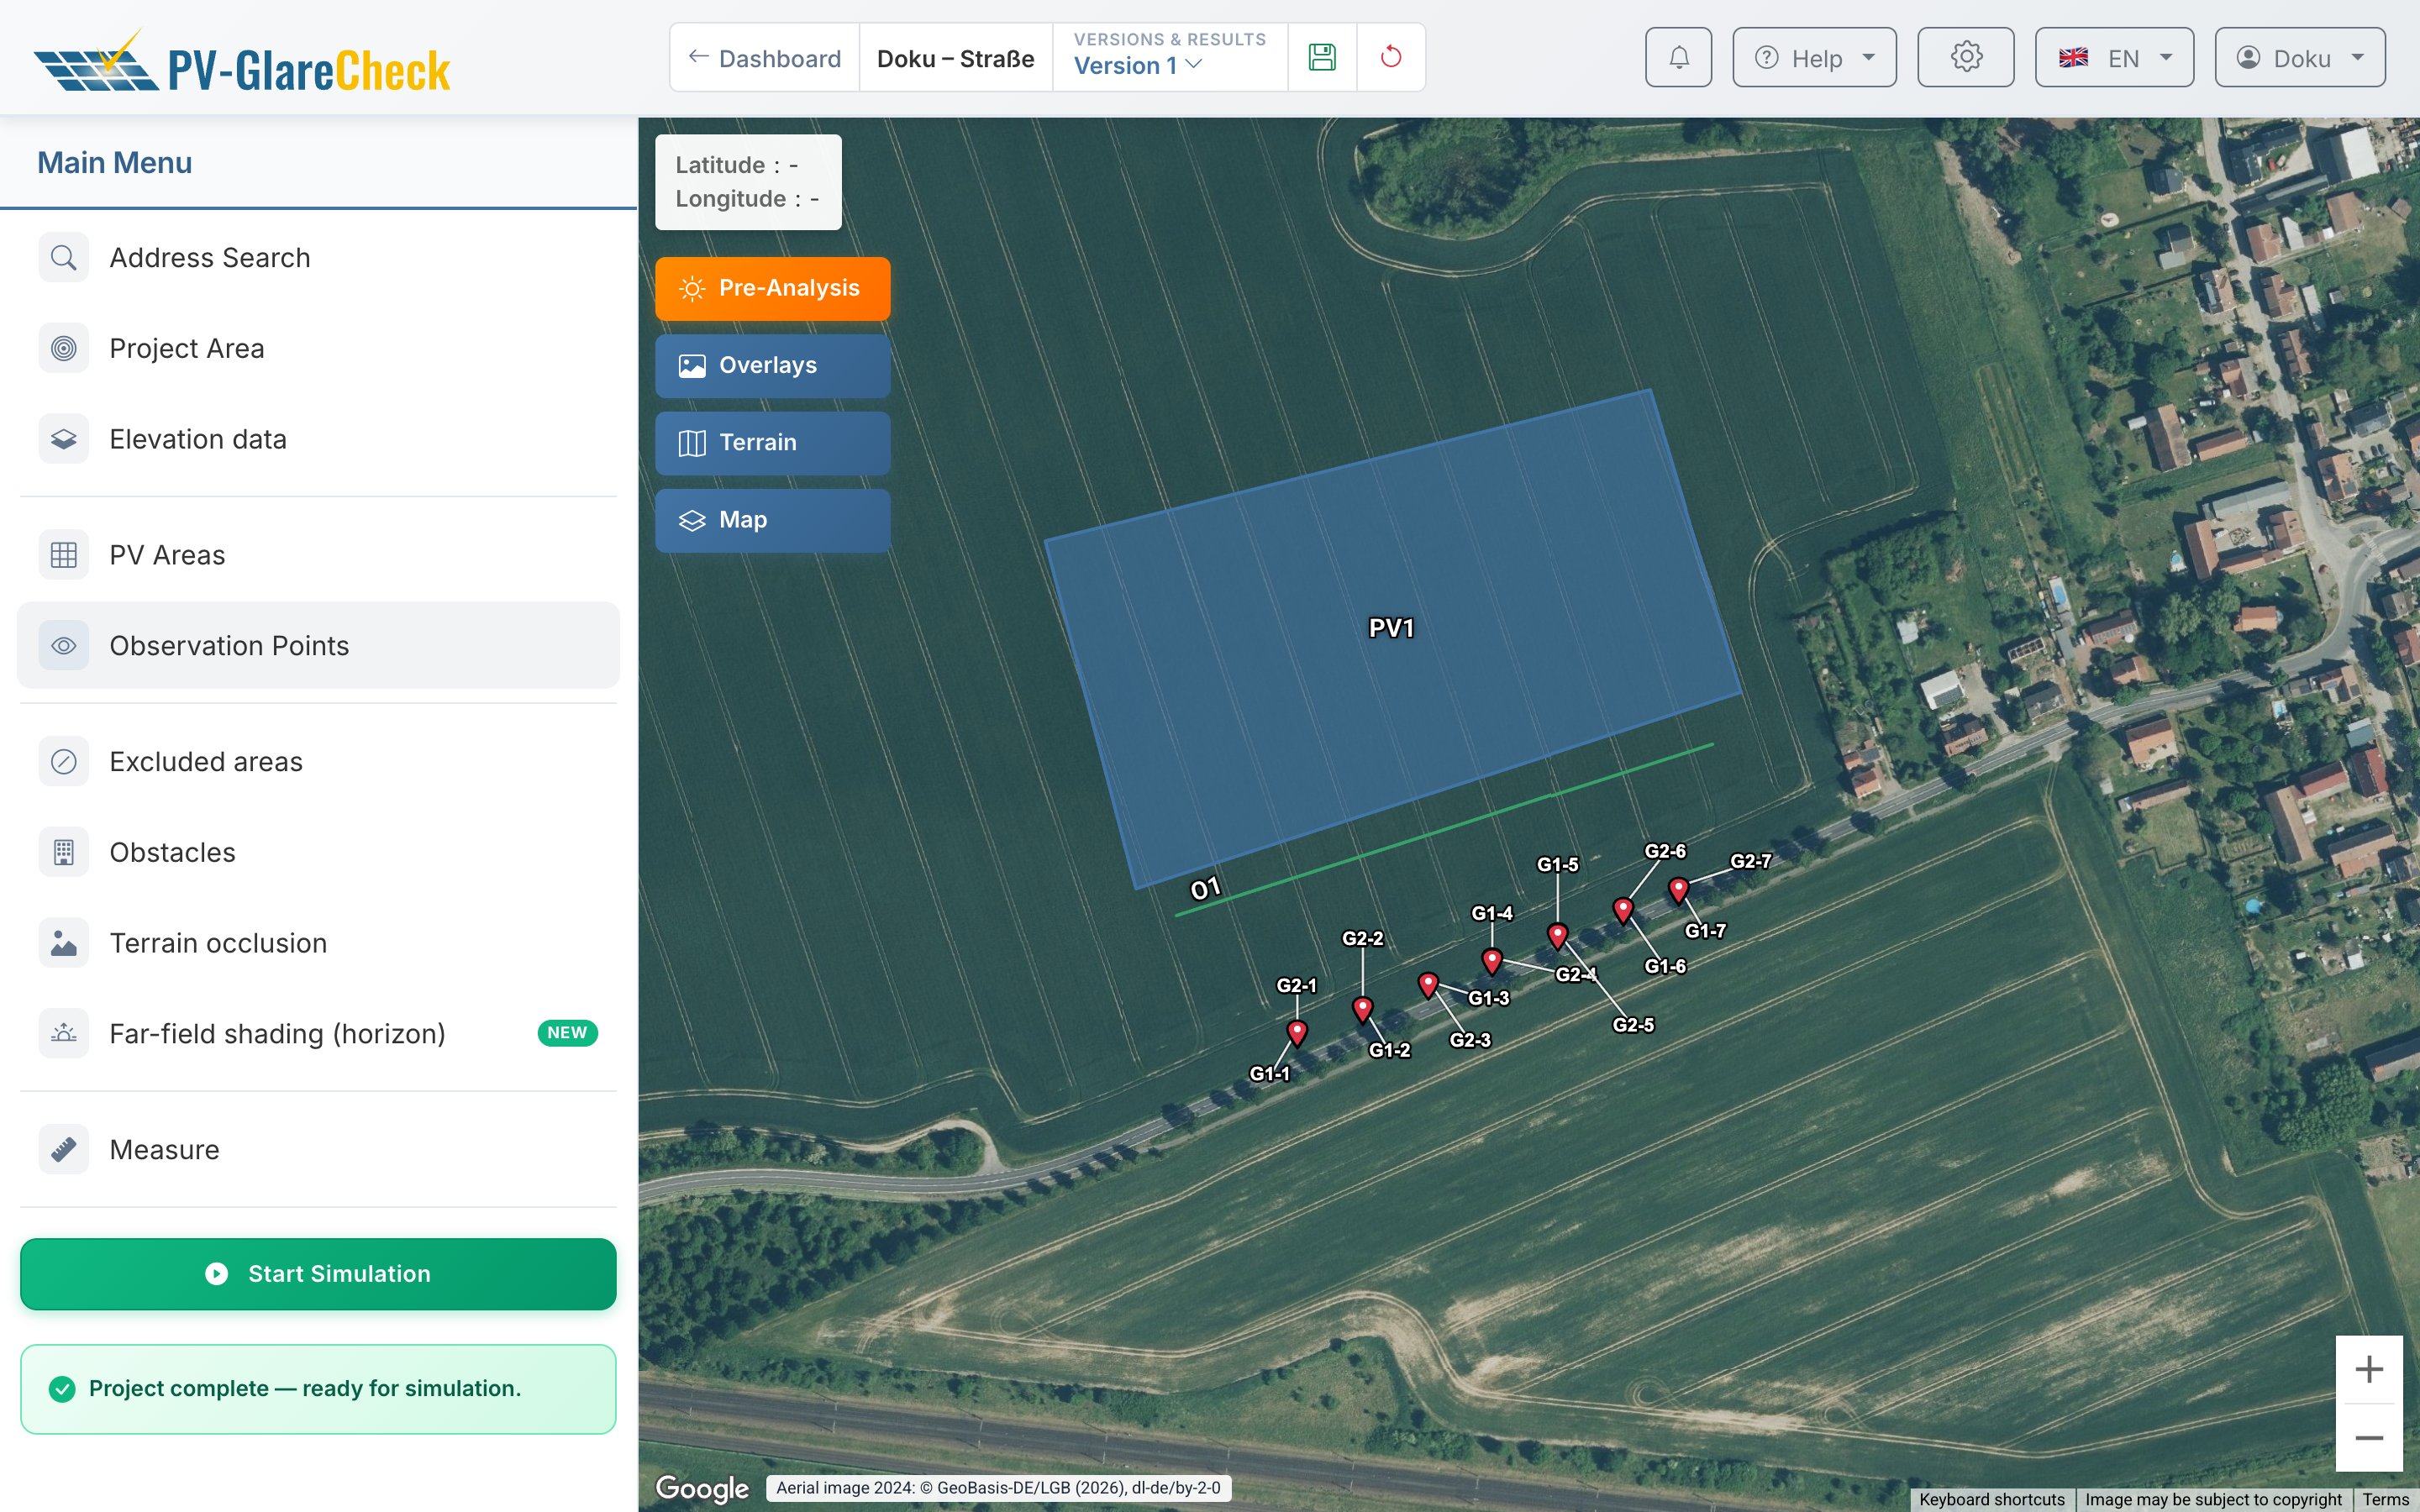
An analysis consists of six steps: create a project, set the location, check the elevation data, draw the PV areas, place observation points at the locations to be checked and start the simulation. The report with all results is then available. The "To-Do List" in the editor shows at any time which inputs are still missing for the start. An assessment often involves several passes with changed inputs (section 2.5).
2.1 How to
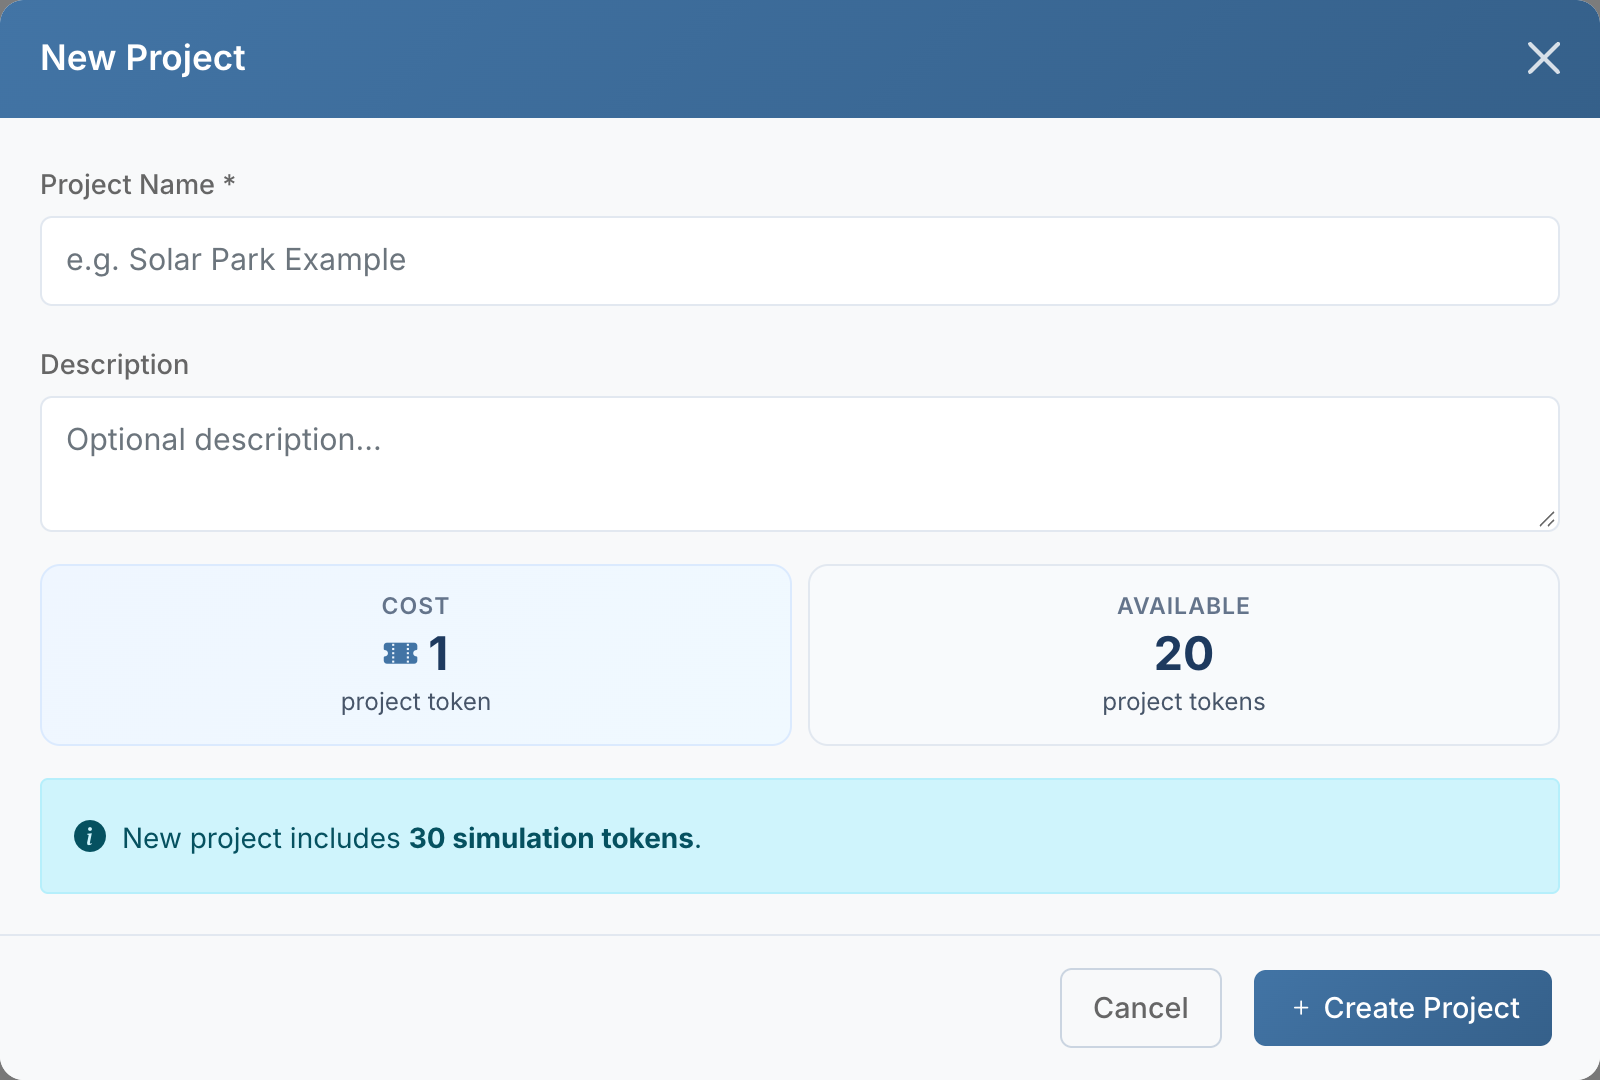
- Create a project. In the dashboard, choose "New Project" and enter a name. This uses one project token; the project receives 30 simulation tokens. A demo project is possible once without a project token (Ch. 3, Ch. 4).
- Set the location. Go to the site via "Address Search" and, under "Project Area", place the center roughly in the middle of the planned PV areas: a circle with a 3 km radius in which all PV areas must lie. Then check the suggested "Time zone" in the "Project Settings"; all times in simulation and report are standard time of this zone (Ch. 5).
- Check the elevation data. In the "Elevation data" menu, define where the GL comes from. A terrain model is optional, but required for the terrain view, cross-tilt zones and terrain occlusion (Ch. 6).
- Enter PV areas. With "New PV area", choose the system type and the input method, then set orientation, heights and module type (Ch. 7, Ch. 8). For ground-mounted areas, define the terrain of the area (Ch. 7.5, Ch. 7.6).
- Place observation points. Create a group with "New group", place points and enter the eye height; a field of view is optional (Ch. 9).
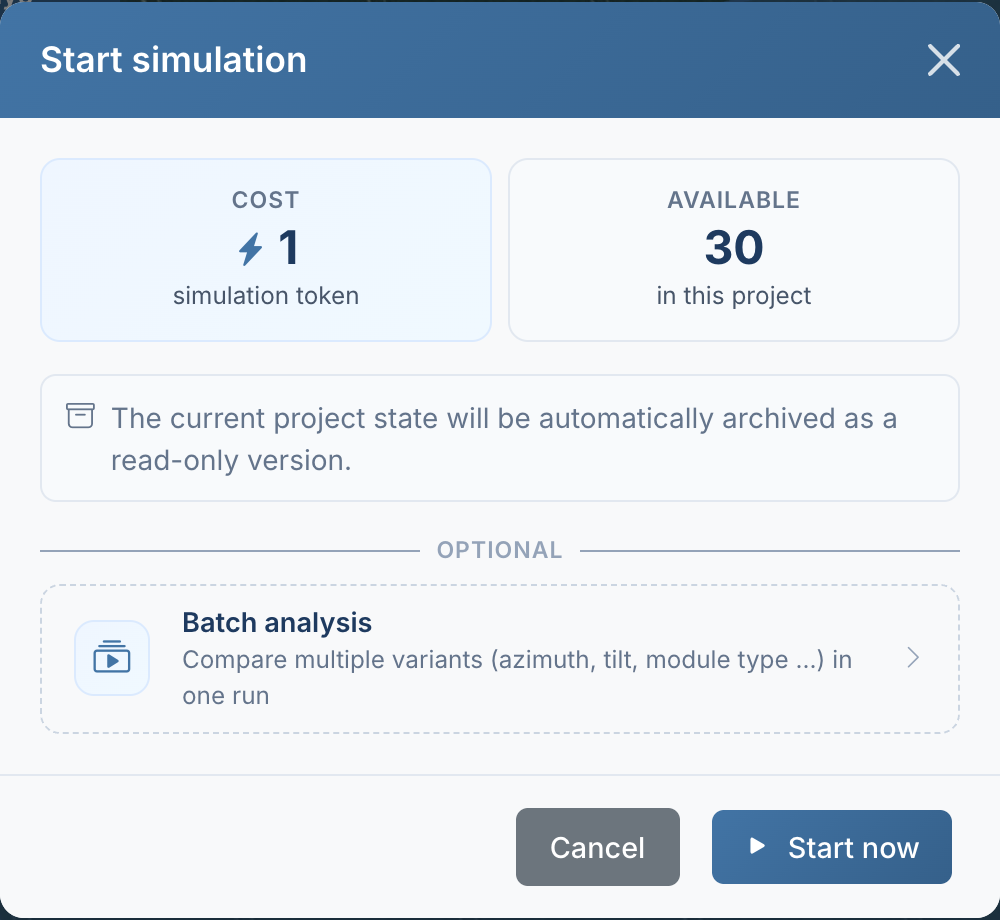
- Start the simulation. When the To-Do List is empty, choose "Start simulation"; this costs one simulation token (Ch. 12). Then set filters per group in the report, fill in the cover page and generate the PDF with "Create PDF" (Ch. 14).
Steps 3 to 5 can be done in any order. Until the project area is set, only "Address Search" and "Project Area" are enabled in the editor.
2.2 Optional inputs
| Input | Effect | Chapter |
|---|---|---|
| Excluded areas | exclude sub-areas without modules | Ch. 7.7 |
| Obstacles | occlude sun and reflections at close range | Ch. 10.1 |
| Far-field shading | accounts for mountains and distant terrain per PV area | Ch. 10.2 |
| Pre-analysis | shows the reflection directions before the points are placed; no token | Ch. 11 |
2.3 Before the start
As long as the "To-Do List" contains entries, "Start simulation" is locked; clicking an entry leads to the affected place. At the start, the server additionally checks plan limits, storage, token balance and whether the PV areas lie within the project area.
2.4 Points to note
- Project area: set once; a wrongly placed area requires a new project (Ch. 5).
- Time zone: The suggestion is determined for the centre of the project area, or estimated from the longitude as a fallback; check it, because time zone boundaries do not follow the meridians. UTC−12 to UTC+14 can be selected, including the zones with half and three-quarter hours (Ch. 5).
- Simulation version: After successful completion, the server saves the state at the start as a read-only copy ("… · Sim-Backup …") to which the results are attached, even if the browser was closed in the meantime; work continues in the previous version (Ch. 4).
- Only one simulation runs per account at a time; a further start during a run is rejected.
2.5 Working iteratively
An assessment rarely results from a single run. Typical reasons for several passes:
- Installation parameters not exactly known: If the orientation, tilt or module type of an existing installation is not exactly known, they are varied until the simulation reproduces observed or measured glare times.
- Finding a solution: Where glare has been found, orientation, tilt, module type or screening are changed until the result meets the chosen guideline value.
- Uncertain inputs: If heights or eye heights are only roughly known, several runs show how strongly the result depends on them.
| Function | Contribution to iterative work | Chapter |
|---|---|---|
| Sim-Backup | every run is kept with its input state and report; an earlier state can be opened and edited further via "Duplicate" | Ch. 4 |
| Notes per version | the reason for and assumptions of a run stay recorded with the version | Ch. 4 |
| Pre-analysis | shows the reflection directions of a changed design before the simulation, without a token | Ch. 11 |
| Filters in the report | guideline values and filters take effect immediately, without a new simulation | Ch. 14 |
| Batch analysis (Pro) | up to 20 variants of azimuth, tilt, module type and dual orientation in one run | Ch. 13 |
| Version comparison (Pro) | key figures of 2 to 5 variants side by side | Ch. 13 |
| Worst-case combination (Pro) | least favourable case across the variants as a separate report | Ch. 13 |